Results and deployment
This chapter describes the results achieved with the new architecture and software for high-speed network traffic processing (FETA module). The new FETA module was integrated into the original FETA probe firmware, which now has two main variants: (i) a probe with a single 400G Ethernet interface and (ii) a probe containing two 100G Ethernet interfaces. The 400G variant of the probe can be built using the Reflex CES XpressSX AGI-FH400G card, and the 2x100G probe can be built on top of the Silicom N6010 card.
The entire FPGA firmware, including the newly designed and implemented FETA module, was written in VHDL 2008. Synthesis and implementation for the target FPGA cards were performed using Intel Quartus Prime Pro 22.4. The firmware was tested using functional verifications. The entire probe, including the connection to the ipfixprobe SW, was tested using HW tests using the FlowTest tool 1. Subsequently, the probe in the 2x100G variant was deployed at a measurement point in the CESNET3 network.
FPGA resource usage
Table 1 shows the FPGA resource consumption after implementing the main components of the 400G probe after integrating the FETA module (architecture). The total resource usage is shown in percentages relative to the size of the target FPGA chip (AGIB027R29A1E2VR0). The most resource-intensive component is the Data Export component, which implements most of the packet operations on the 2048b wide data bus (inserting metadata, trimming the packet length, working with exports, and more). The packet filter is particularly demanding on a large number of Memory ALM blocks, where the filter rules are stored. Other components that take up a significant portion of the resources include the Packet Analyser and the FETA Acceleration Module (FAM).
| Component | Total ALMs | Memory ALMs | Flip Flops | M20K (BRAM) |
|---|---|---|---|---|
| Packet Analyser | 31,970 (3.5%) | 2,700 | 45,735 | 2 (0.0%) |
| RSS | 5,905 (0.6%) | 0 | 12,906 | 5 (0.0%) |
| Flow Hash | 7,375 (0.8%) | 0 | 0 | 0 (0.0%) |
| FAM | 30,759 (3.4%) | 8,500 | 67,145 | 545 (4.1%) |
| Packet Filter | 42,056 (4.6%) | 21,150 | 5,981 | 4 (0.0%) |
| Packet FIFO | 1,100 (0.1%) | 0 | 6,349 | 420 (3.2%) |
| Data Export | 93,889 (10.3%) | 7,460 | 96,614 | 287 (0.14%) |
| Total | 213,054 (23.3%) | 39,810 | 234,730 (6.4%) | 1,263 (9.5%) |
Table 1: FPGA resource consumption of the main components of the 400G probe.
The following Table 2 shows the FPGA resource consumption after implementing the entire FETA probe, including the DMA controller and other necessary parts of the NDK platform. The total resource usage is shown in percentages relative to the target FPGA chip size.
| Firmware | Total ALMs | Memory ALMs | Flip Flops | M20K (BRAM) |
|---|---|---|---|---|
| 400G probe | 600,424 (65.8%) | 72,060 | 848,081 (23.2%) | 3,988 (30.0%) |
| 2x100G probe | 288,739 (59.3%) | 41,200 | 541,616 (27.8%) | 2,600 (36.6%) |
Table 2: FPGA resource consumption of two variants of the entire FPGA probe firmware.
The 400G probe variant was implemented for the Reflex CES XpressSX AGI-FH400G FPGA card with the Intel Agilex 7 AGIB027 FPGA chip (AGIB027R29A1E2VR0). The 2x100G probe variant was implemented for the Silicom N6010 FPGA card with the Intel Agilex 7 AGFB014 FPGA chip (AGFB014R24A2E2V). In both cases, a significant portion of the resources (less than ⅔ of the ALM for the 400G probe) is consumed by the NDK platform itself, especially the DMA controller. In order for the FPGA probe to support higher speeds, it must internally use wider data buses (2048b@200MHz for 400G Ethernet). The complexity of the logic for processing network traffic increases with the data width and the number of packets per clock, so the resource consumption of a 400G probe is more than 2x greater than that of a 2x100G probe.
Figure 1 was obtained using the Intel Quartus Prime Pro tool and graphically shows the utilization of the FPGA chip after implementing the entire FETA firmware of the 400G probe. Although approximately 66% of the ALM blocks are used, they are spread over almost the entire area of the chip. The light blue part implements 400G Ethernet support, the red area is used for the actual processing of network packets (probe components: Packet Analyser, FAM, Packet Filter, Data Export, etc.), the purple area implements the DMA controller, and the green areas implement support for two PCIe Gen4 x16 endpoints.
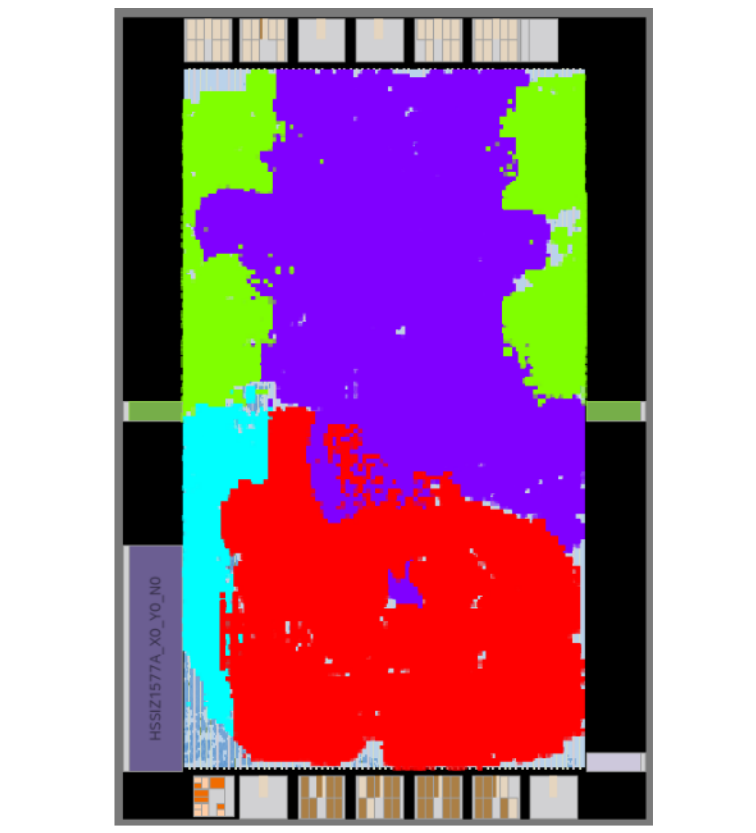 Figure 1: Utilization of the Intel Agilex FPGA chip with the FETA firmware of the 400G probe.
Performance of CTT module
To analyze the performance parameters of the Connection Tracking Table (CTT) module, we used the 400G variant of the FPGA probe implemented on the Reflex CES XpressSX AGI-FH400G FPGA card. We measured the behavior of the CTT module under realistic network traffic conditions. For this purpose, the FlowTest tool was used, which allows the generation of network traffic according to predefined profiles representing different real networks. The profiles tested included both academic and commercial network traffic types:
- GEANT, Afternoon Dropoff (G_AD)
- GEANT, Morning Rise in traffic (G_MR)
- GEANT, Spike in traffic (G_S)
- NIX, Afternoon Dropoff (N_AD)
- NIX, Morning traffic (N_M)
- NIX, Night Low traffic (N_NL)
- NIX, Workday Peak (N_WP)
The GEANT network is typical for transmitting a large amount of scientific data, so there are rather large packets and a smaller number of heavy flows. On the contrary, the NIX network has the character of a regular commercial network, so there are rather smaller packets and more light network flows.
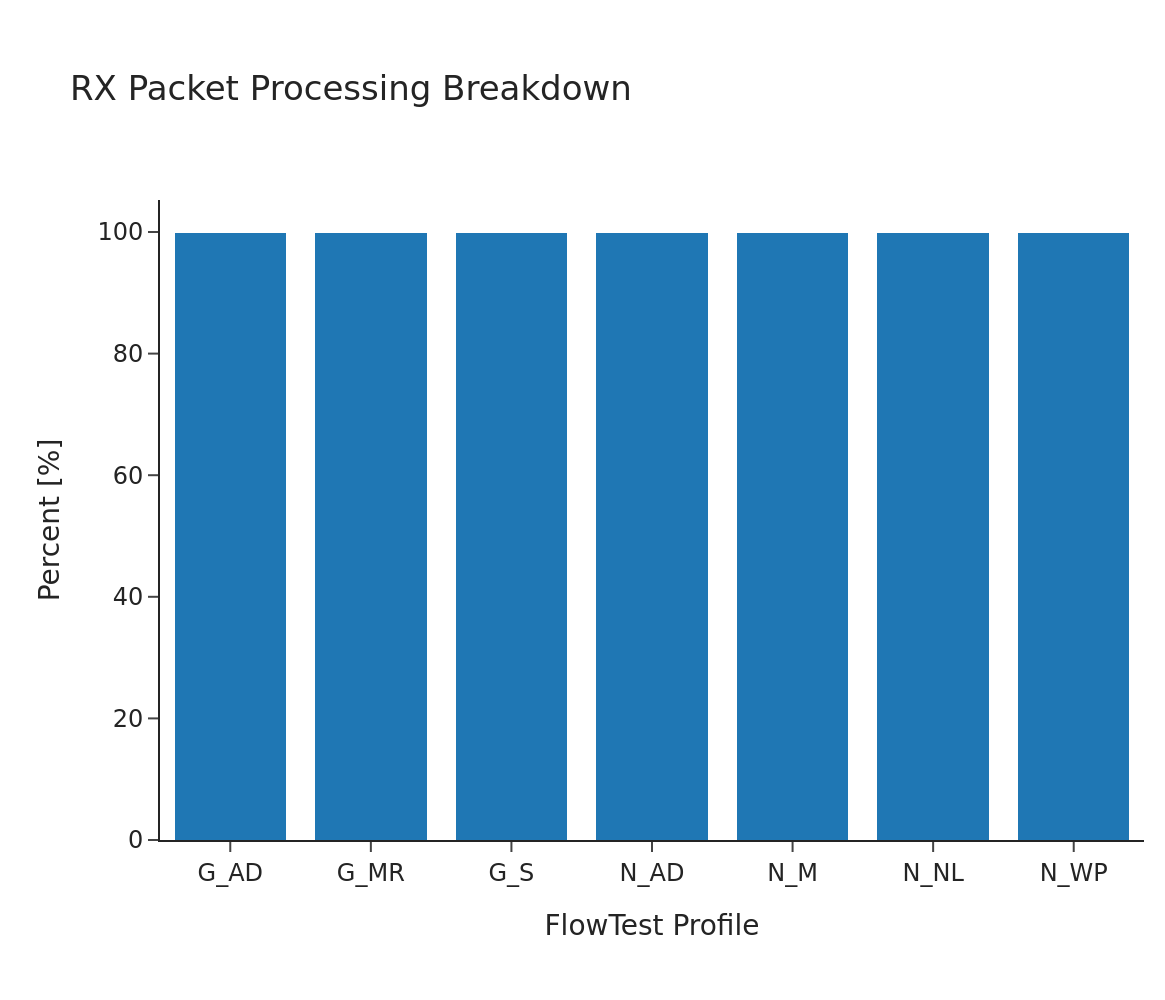 Figure 2: Packet processing performance of 400G CTT module.
The test results confirmed the robustness and high performance of the implemented module. Figure 2 shows that the CTT can handle 100% of the network traffic at line rate for all profiles tested. Thus, the module demonstrates reliable and high performance under a variety of load types.
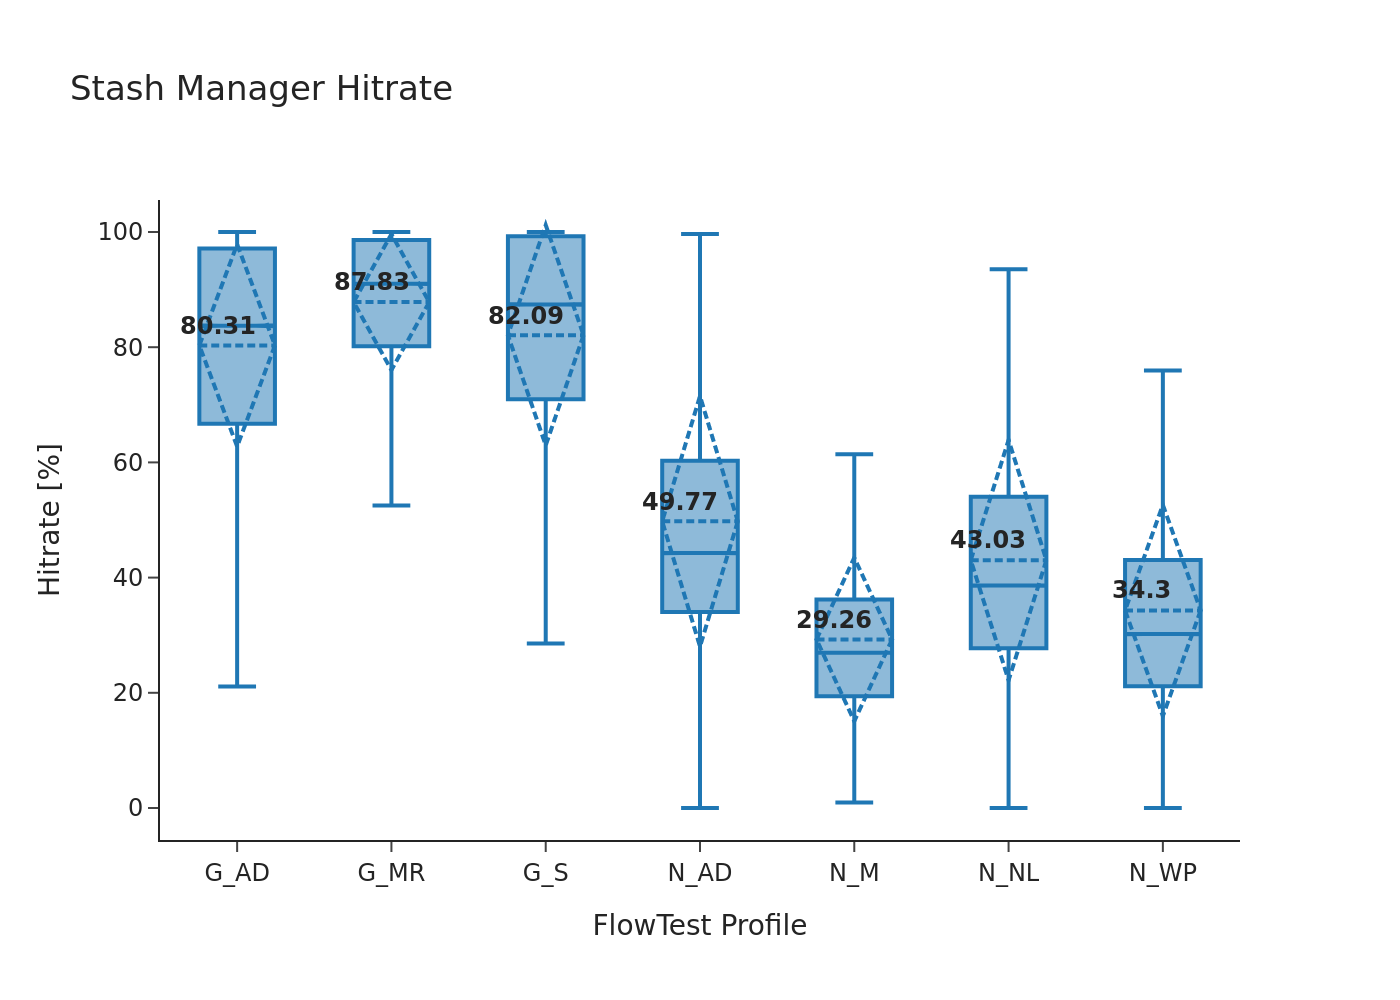 Figure 3: Hit rate of 400G CTT module Stash Manager (also referred to as Flow State Manager).
The functionality of the caching mechanism integrated in the CTT module is illustrated in Figure 3, which shows the average hit rate for each profile. For profiles from the GEANT network, the average hit rate reaches over 80%, while for profiles from the NIX network it is lower, around 40%, due to the larger number of unique flows, which corresponds to the expected behaviour and confirms that the system design matches the characteristics of the specific traffic.
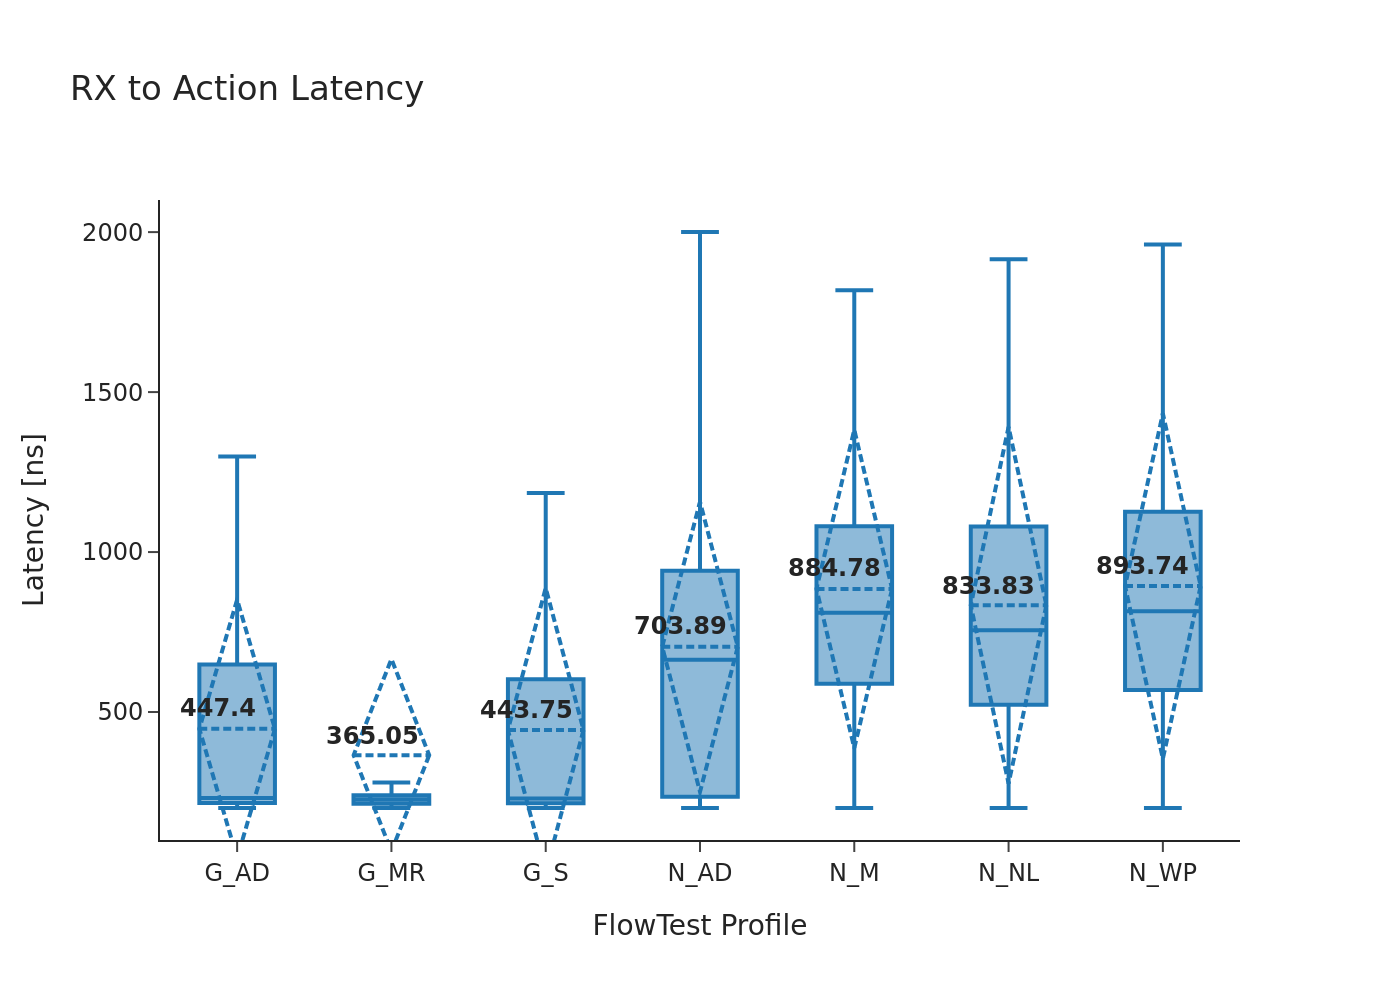 Figure 4: Latency of 400G CTT module.
In the latency analysis, we measured the processing delay of individual packets within the CTT module. The type and behavior of the external memory (DRAM) used has the greatest impact on latency. As the graph in Figure 4 shows, the average latency ranges from 0.3 to 0.9 μs. In marginal cases, latency can get as high as 2 μs, which is typically due to the fact that the external DRAM has to periodically perform a refresh operation to prevent the loss of stored data. The latency of the CTT module is as expected.
Deploying a probe in the CESNET3 network
The developed probe with the FETA module was successfully deployed in a test run in the CESNET3 network, specifically on a measurement point using a 2×100G probe on a Silicom N6010 card. Long-term deployment in a real network environment confirmed the stability and functionality of the proposed solution. In addition to the deployment in a production network, a successful verification of the 400G version of the probe with the FETA module under laboratory conditions was also performed. The HW tests performed confirmed that the architecture is ready for deployment in high-speed networks with the aim of long-term monitoring of network traffic and real-time anomaly detection.
At the same time, the speedup of ipfixprobe was clearly verified by integrating the Connection Tracking Table (CTT) component into the FPGA. For example, the “GEANT Morning” network profile, which contains a smaller amount of very intensive flows, showed significant packet dropping when acceleration was disabled (5.17% of packets were dropped). However, with active CTT acceleration, these losses practically disappeared (0.01% of packets were discarded), which has a positive impact on the accuracy of the measurements, the collection of features about the network traffic, and therefore the resulting classification. See also Table 3.
| Acceleration | Packets (processed / total) | Bytes (processed / total) | Packet drop rate |
|---|---|---|---|
| CTT ENABLE | 1421412040 / 1421501280 | 1639166631668 / 1639289910680 | 0.01% |
| CTT DISABLE | 1348058442 / 1421501280 | 1540467652756 / 1639289910680 | 5.17 % |
Table 3: Number of dropped packets with ipfixprobe acceleration enabled and disabled.
The benefits of the developed solution were also shared with the professional community through a presentation at the TNC 2025 conference2, which serves as the main forum for the pan-European academic networking community associated under the GEANT organisation. At the same time, a demonstration has been accepted for the FPL 2025 conference, the largest international scientific conference focused on FPGA technology, where a hands-on demonstration of accelerating network flow processing using a real-time CTT component will be presented3.