Created Datasets
The V4 result includes a total of 26 different datasets. In this section, we present the two most significant ones, which were published in the journal Nature Scientific Data: CESNET-TLS-Year22 and CESNET-TimeSeries24. A complete list of all created datasets is provided in the final subsection, including usage statistics obtained from the Zenodo platform and from the telemetric data of the CESNET DataZoo and CESNET TSZoo tools.
CESNET-TLS-Year22: Dataset with a year of TLS traffic
With the growing proportion of monitored encrypted traffic (especially TLS and QUIC protocols), the importance of classification methods that provide insight into it is also increasing. Historically, encrypted traffic was analyzed mainly using unencrypted headers sent when establishing a connection. For TLS, these are primarily fields from the server certificate and the Server Name Indication extension. However, in new versions of the TLS protocol, these fields are being restricted, which creates a research question of how to replace the loss of this useful information.
For this reason, within the project, we focused on the long-term capture of encrypted TLS traffic and created a dataset called CESNET-TLS-Year22. The unique feature of this dataset is its length: the dataset contains a year of traffic captured on the CESNET3 backbone network. The one-year time period allows for the evaluation of detection tools (for example, trained machine learning models) over a long time horizon and thus measures their robustness and ability to cope with changes on the network. Changes in the characteristics of network traffic are to be expected. They are caused by newly emerging applications and services, changes in protocols, but also by the time of day or the period of the year (different traffic during holidays and the school year). The CESNET-TLS-Year22 dataset is used for the development of classifiers that will be robust to these changes and will therefore be better prepared for production deployment.
Dataset Content
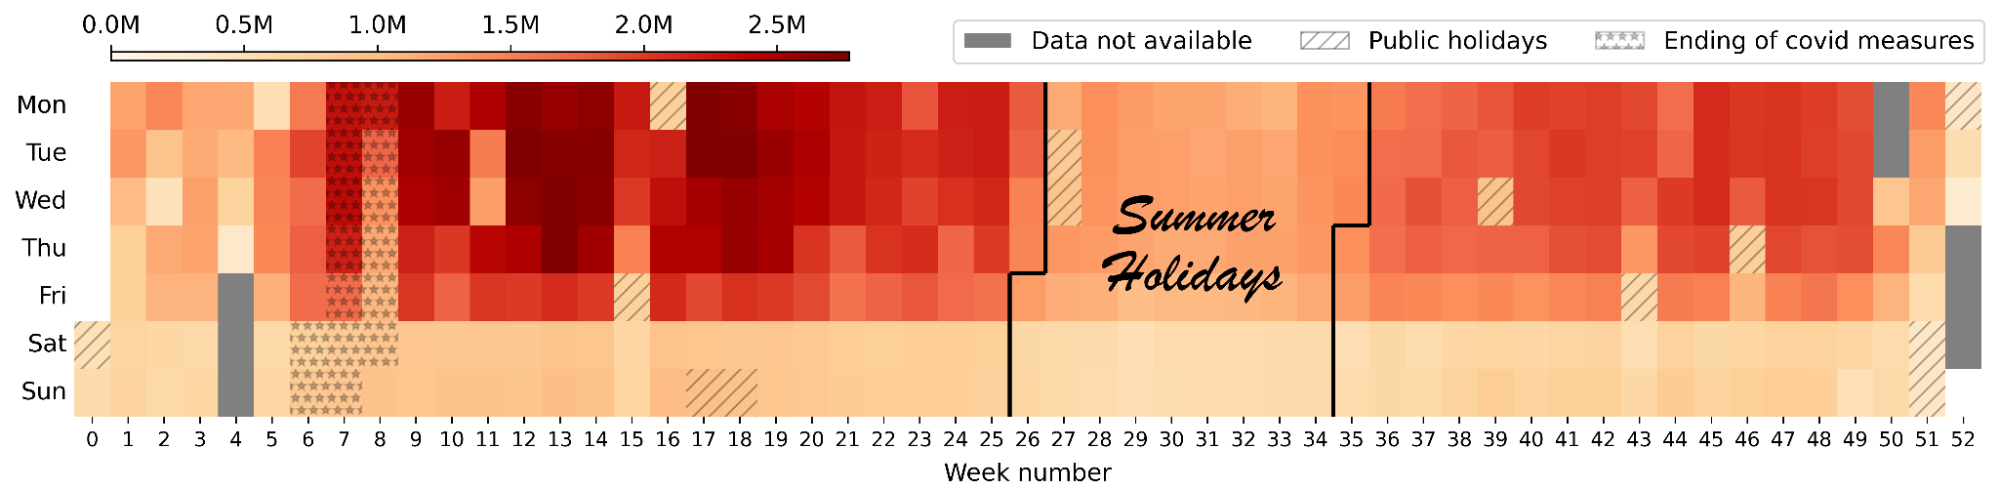
The dataset contains 180 web services with a total of 507 million samples. The samples are organized within the dataset by individual weeks of 2022, as shown in the figure below. Each sample contains a packet sequence, which is a standard input to models analyzing encrypted traffic. The sequence represents the beginning of a TLS connection at the packet level and contains the size, direction, and inter-packet time of the first 30 packets of the connection. Furthermore, the samples contain the domain name (from TLS SNI) and other standard characteristics such as the number of transferred bytes, packets, or the total connection time.
Basic Analysis
Through volumetric analysis, we observed the distribution of samples throughout the year and verified the expected influence of real phenomena on the network traffic recorded in the dataset. The figure below illustrates the following properties:
- Traffic on weekdays strongly prevails over weekends. Similarly, we can observe lower traffic on holidays.
- During the summer holidays, a general decline can be observed. This is expected because many of the organizations connected to the CESNET3 network are universities.
- A large increase in traffic during the summer semester (approximately between weeks 7 and 20) is interpreted as being caused by the relaxation of measures against COVID-19 and a gradual return to in-person teaching and other events.
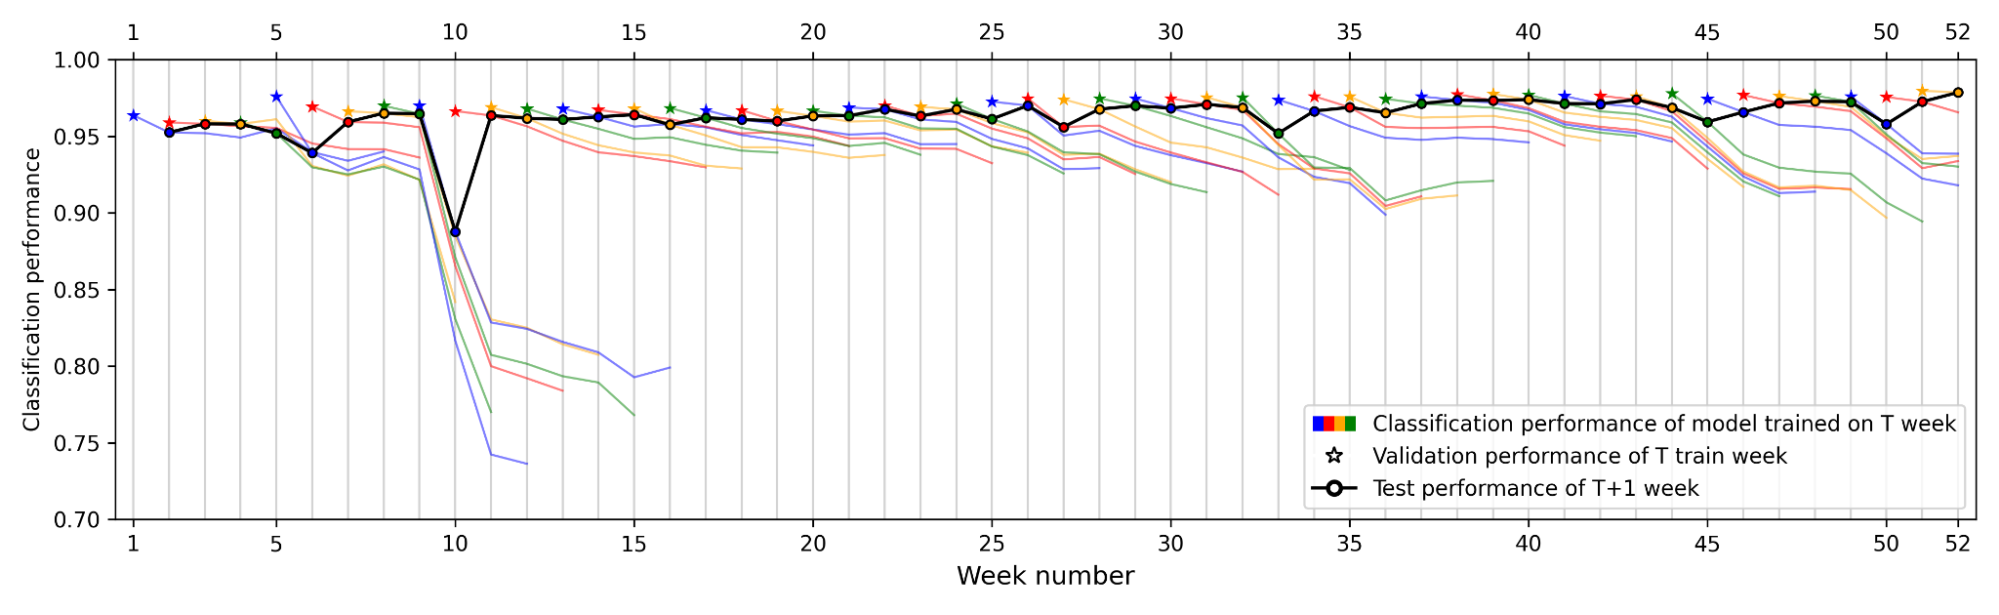
As part of the basic analysis of the dataset, we also evaluated a classification neural network, which we gradually trained on each week of the year and evaluated on the following seven weeks. We reused the proven neural network architecture from our previous research within the project. The goal was to measure how quickly the classifier becomes obsolete, in other words, how quickly its accuracy decreases with the time elapsed between training and evaluation. The figure below shows the results of this measurement for the entire year 2022. The average accuracy of the classifiers one week after training (T + 1) is 96.3%, while for the seventh week after training (T + 8) it is 90.5%. Such a drop is expected and the dataset will allow for the evaluation of new models that will be more robust and less affected by changes on the network. Thanks to this analysis, we discovered a surprisingly large drop around the 10th week. We found that the change was related to a software update of the measuring point due to the introduction of better protection against DDoS attacks, which caused a change in the distribution of packet sequences and subsequently a drop in the performance of classifiers trained before this period. Users of the dataset are duly informed about this in the journal publication presenting this dataset.
CESNET-TimeSeries24: Dataset with time series
Anomaly detection and network traffic prediction are a key part of monitoring network traffic to ensure operation, optimize data flow, and secure network infrastructure. For research into methods for predicting network traffic and detecting anomalies, a dataset is needed that is created by long-term monitoring of a real computer network, otherwise it is not possible to create a model that captures the normal behavior of devices or the entire network. However, such a comprehensive dataset capturing real network traffic over the long term was missing from the research community. Therefore, within the project, we focused on creating the CESNET-TimeSeries24 dataset, which addresses the above-mentioned requirements.
CESNET-TimeSeries24 is an extensive dataset focused on capturing the communication behavior of devices, networks, and institutions over a long time interval. The set contains volumetric statistics in the form of time series about IP addresses and networks, which were obtained from the CESNET3 network infrastructure. The main goal of this dataset is to support the development, tuning, and objective evaluation of anomaly detection and network traffic prediction methods. Unlike most publicly available datasets, which are often based on synthetic data or small regular samples (e.g., a 15-minute record every day), CESNET-TimeSeries24 represents a unique long-term collected dataset that covers 40 weeks of real network traffic.
The dataset contains aggregated telemetry on the traffic of more than 275,000 active IP addresses on the CESNET3 network, which provides internet connectivity for scientific, research, and educational institutions in the Czech Republic. In total, more than 66 billion network flows are included, which together describe approximately 4 trillion packets and represent the transfer of over 3.7 petabytes of data. Thanks to its scope, time coverage, and the variability of the environment, CESNET-TimeSeries24 offers a difficult but realistic benchmark for the development and testing of advanced prediction and anomaly detection methods. The dataset also covers a wide range of network entities, including servers, workstations, game consoles, honeypots, or Wi-Fi routers.
Dataset Content
The dataset is divided into three parts according to the type of monitored entity: individual IP addresses, institutional networks, and entire institutions. For each of these parts, time series with different aggregation granularities are available: 10 minutes, 1 hour, and 1 day. The time series with the original 10-minute aggregation contain the following metrics:
- Volumetric metrics: number of IP flows, packets, bytes
- Unique destination entities: number of unique destination IP addresses, ASNs, and TCP/UDP ports
- Ratio metrics: ratio of UDP/TCP packets and bytes, direction of packets and bytes (from client to server and vice versa)
- Average values: duration of network flows, and TTL value
For hourly and daily aggregations, summary statistics (e.g., average, sum, and standard deviation of the number of unique destination IP addresses, etc.) are added to the metrics representing unique destination entities.
Basic Analysis
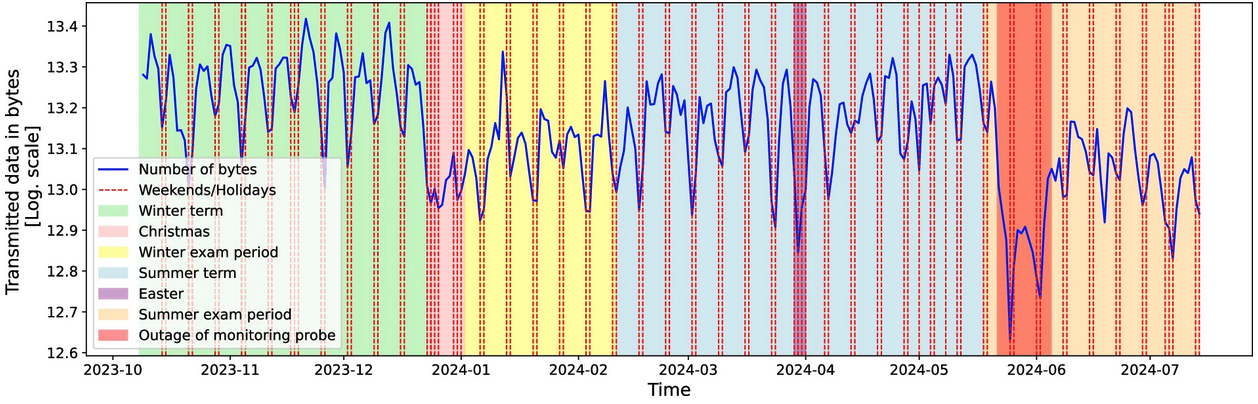
A basic statistical analysis of the CESNET-TimeSeries24 dataset revealed several key characteristics that confirm its real basis and research value. Further analyses show clear seasonal and cyclical patterns in network traffic, especially regular differences between weekdays and weekends. This phenomenon is so significant that it is also clearly visible in the figure below, which shows the total traffic captured in the dataset. In the graph, we see a clear correlation of traffic with weekends, but we also observe a correlation with holidays (Christmas and Easter). The academic environment is also reflected in the traffic by the influence of the ongoing semester and examination period on the overall traffic of the CESNET3 network.
A large part of individual IP addresses shows very low activity, with more than 80% of time windows remaining empty on average with 10-minute aggregation. This is a consequence of the normal behavior of devices on the network, where most devices communicate only occasionally. While for aggregations at the level of entire institutions or individual institutional networks, the rate of inactivity is significantly reduced, for individual IP addresses, the gaps in monitoring present a challenge that needs to be addressed when modeling for the purpose of predicting network traffic.
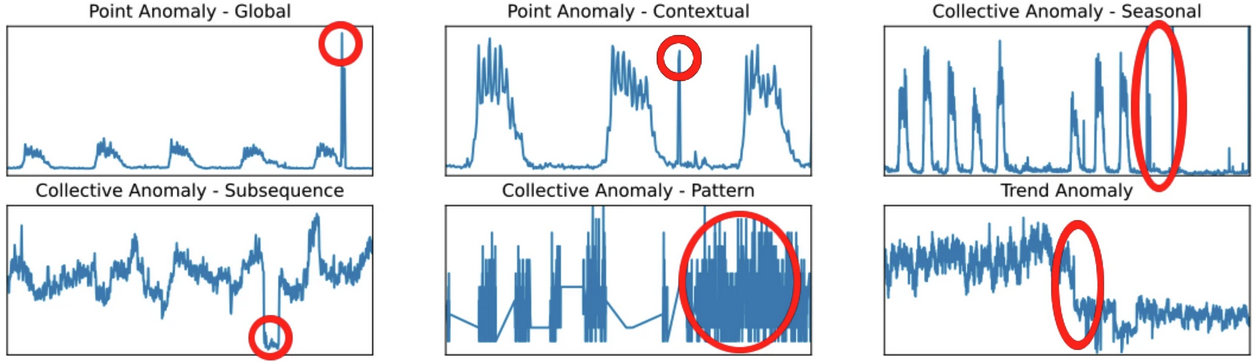
The analysis also showed that the dataset contains a whole range of typical network anomalies that are essential for research into anomaly detection. The figure below shows all found types of anomalies. As can be seen, not only point anomalies, which are the most typical in network traffic, but also collective and trend anomalies were identified. Collective anomalies include, for example, deviations from the expected seasonal behavior or a change in the behavior of a time series. A trend anomaly, on the other hand, indicates a sudden change in the trend of the behavior of a network entity while maintaining the same seasonality.
The analysis shows that CESNET-TimeSeries24 is a dataset with a rich structure, a realistic occurrence of anomalies, and at the same time sufficient complexity for testing modern machine learning algorithms and classical statistical methods. Also, thanks to the large number of time series, it is possible to evaluate the robustness of models across different behaviors of individual devices or entire networks.
Summary of all created datasets
Within the result, a large number of unique datasets were created, which are gradually gaining popularity in the professional community. This is evidenced not only by citations of articles about the datasets, but also by other metrics such as the number of downloads from data repositories. This section contains a summary of all created datasets along with statistics on the number of downloads and citations. For clarity, we have divided the created datasets into the following four categories:
- Real — Datasets created by monitoring real network traffic
- Generated — Datasets created by generating network traffic
- Derived — Datasets created by deriving network traffic from published public data
- CTI — Datasets containing information about security threats
In total, 26 datasets were created, some of which are highly unique and are becoming a standard for evaluating and comparing machine learning methods in the field of computer network monitoring (so-called benchmarking). The total number of datasets and the number of downloads from the Zenodo platform or through the developed tools (DataZoo and TSZoo) can be seen in the table below. Statistics for individual datasets are further contained in the following sections.
Table: Overall statistics of the use of published datasets within the FETA project
| Dataset | Number of datasets | Total number of downloads |
|---|---|---|
| Real | 12 | 11,357 |
| Generated | 6 | 1,921 |
| Derived | 4 | 6,653 |
| CTI | 4 | 2,165 |
| Total | 26 | 22,096 |
Real datasets
The datasets that have established themselves the most in the community are those that were created by monitoring real network traffic, especially from the CESNET3 network. The table below shows the number of downloads and the number of citations for individual datasets from the Zenodo platform and from the developed tools CESNET DataZoo and TS-Zoo (described in the chapter below).
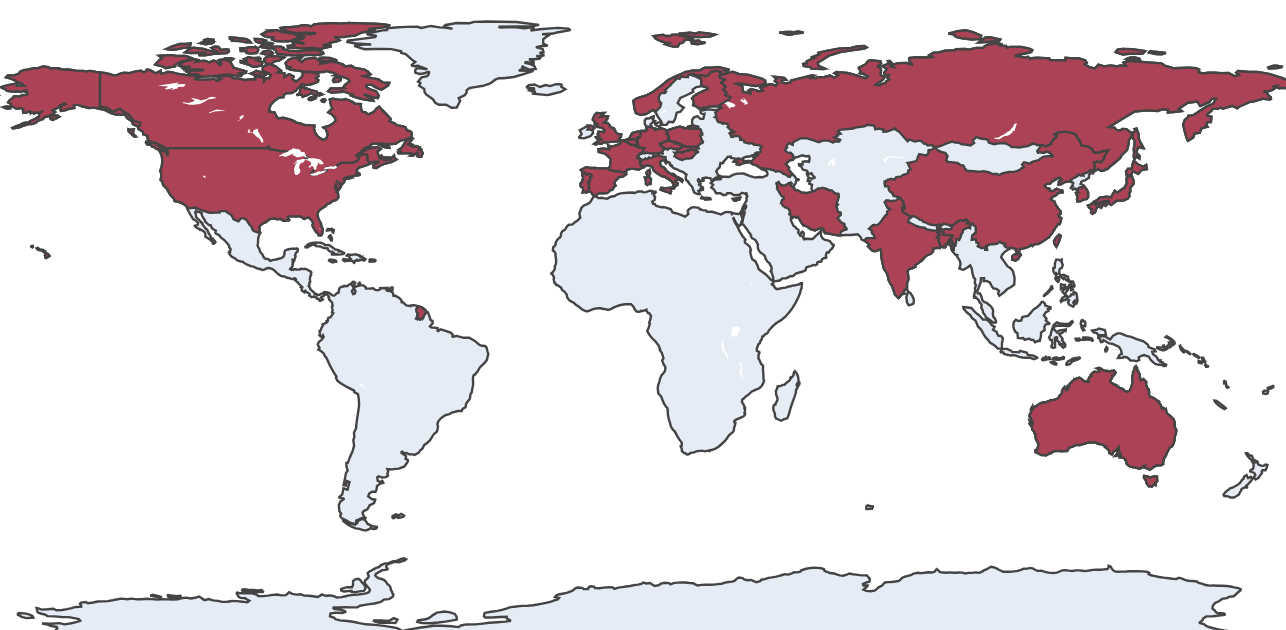
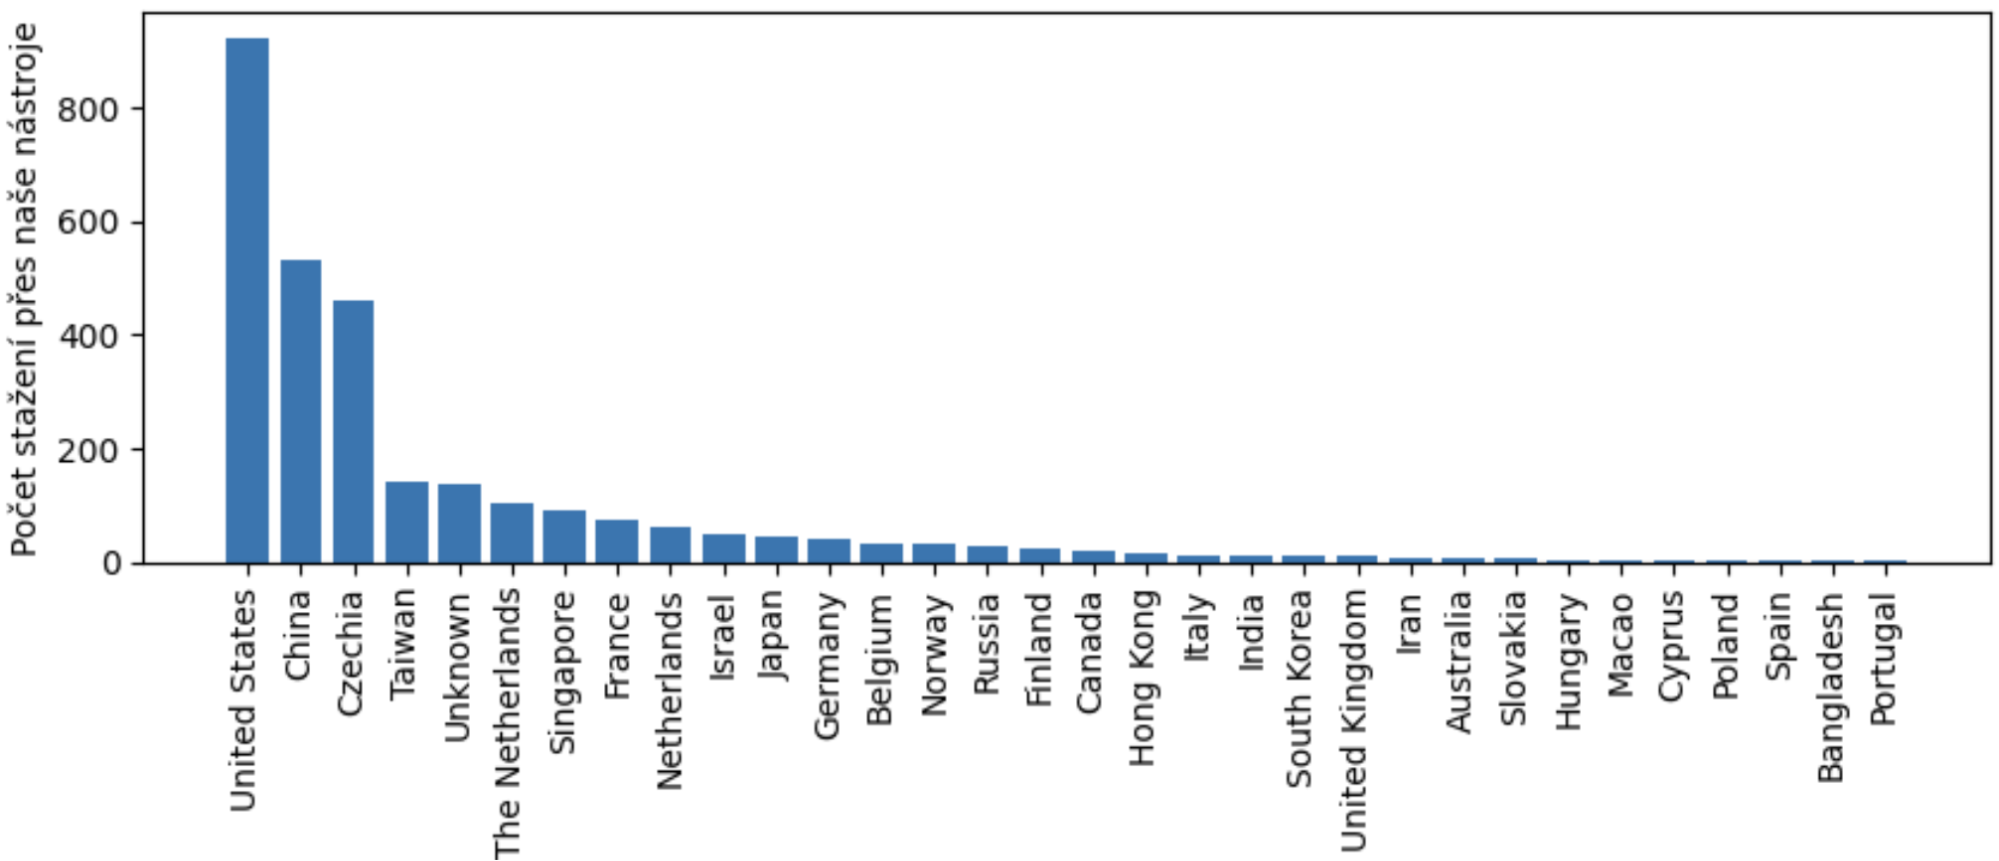
The telemetry obtained from the CESNET DataZoo and TS-Zoo tools also obtains geolocation from the public IP addresses of clients downloading the data. The countries from which the download of our datasets was recorded are shown in the figures below. It can be seen that the datasets are used by researchers from all over the world in at least 32 countries. We observe the most downloads from the United States of America, China, the Czech Republic, and Taiwan, as can be seen in the second figure.
Table: Statistics on the use of published datasets created by monitoring real network traffic. The “Total number of downloads” metric is the sum of the number of downloads from the Zenodo platform and the number of downloads via our CESNET DataZoo and CESNET TS-Zoo tools (if the given dataset is in any of these tools). The statistical metrics were obtained from the Zenodo website and from our CESNET DataZoo and CESNET TS-Zoo tools as of June 17, 2025.
| Dataset | Dataset publication date | Number of Zenodo downloads | Number of downloads using our tools | Total number of downloads | Citations of the article with the dataset (according to Google Scholar) |
|---|---|---|---|---|---|
| CESNET-TLS-Year22 | 2. 2. 2024 | 194 | 1290 | 1,484 | 3 |
| CESNET-TimeSeries24 | 27. 9. 2024 | 4478 | 79 | 4,557 | 5 |
| CESNET-QUIC22 | 7. 12. 2022 | 1827 | 947 | 2,774 | 29 |
| CESNET-TLS22 | 1. 2. 2022 | 525 | 439 | 964 | 45 |
| CESNET-AGG23 | 13. 6. 2023 | 55 | 2 | 57 | 4 |
| CESNET-MINER22 | 12. 10. 2022 | 65 | - | 65 | 13 |
| CESNET-USTS23 | 11. 5. 2023 | 438 | - | 438 | 5 |
| DoH – Real-World | 3. 2. 2022 | 903 | - | 903 | 18 |
| Five-week DoH dataset | 15. 9. 2023 | 33 | - | 33 | 0 |
| OS fingerprinting | 20. 1. 2025 | 22 | - | 22 | 0 |
| Dataset for Advanced Similarity Metrics | 4. 11. 2024 | 60 | - | 60 | 0 |
| Total | 11,357 | 122 |
Generated datasets
Other datasets created within the project are so-called generated datasets. These datasets were created as part of research focused on the encrypted DNS protocol, specifically DNS over HTTPS (DoH). An overview of these datasets along with the number of their downloads from the Zenodo platform is given in the table below.
Table: Statistics on the use of published datasets created by generating network traffic. The “Total number of downloads” metric is the number of downloads from the Zenodo platform. The statistical metrics were obtained from the Zenodo platform as of June 17, 2025.
| Dataset | Publication date | Total number of downloads |
|---|---|---|
| DoH-Gen-C-AABBCC | 4. 2. 2022 | 237 |
| DoH-Gen-C-CFGHOQS | 4. 2. 2022 | 279 |
| DoH-Gen-C-DDD | 4. 2. 2022 | 240 |
| DoH-Gen-F-AABBC | 3. 2. 2022 | 659 |
| DoH-Gen-F-CCDDD | 4. 2. 2022 | 212 |
| DoH-Gen-F-FGHOQS | 4. 2. 2022 | 294 |
| Total | 1,921 |
Derived datasets
Within the project, when comparing newly proposed methods with existing algorithms, we also used well-known publicly available datasets. Based on these sets, we created derived datasets that contain innovative features suitable for detecting network threats. An overview of these derived sets, including the number of downloads from the Zenodo platform, is given in the table below.
Table: Statistics on the use of published datasets derived from network traffic obtained from published datasets. The “Total number of downloads” metric is the number of downloads from the Zenodo platform. The statistical metrics were obtained from the Zenodo platform as of June 17, 2025.
| Dataset | Publication date | Total number of downloads |
|---|---|---|
| TSA of SFTS datasets | 14. 6. 2023 | 4,237 |
| NetTiSA datasets | 30. 8. 2023 | 2,302 |
| CESNET-MINER22-TS | 13. 6. 2023 | 108 |
| Bota dataset | 2. 4. 2022 | 6 |
| Total | 6,653 |
CTI datasets
The V4 result also includes datasets beyond the characteristics of network traffic. The research team also created datasets with a verified list of internet servers offering DNS over HTTPS (DoH) or datasets for detecting malware and phishing by domain names. These datasets, along with the number of downloads, are listed in the table below.
Table: Statistics on the use of published datasets that do not contain network traffic. The “Total number of downloads” metric is the number of downloads from the Zenodo platform. The statistical metrics were obtained from the Zenodo platform as of June 17, 2025.
| Dataset | Publication date | Total number of downloads |
|---|---|---|
| DoH Internet Servers | 4. 4. 2022 | 1,845 |
| Benign, Phishing and Malware Domain Names 2024 | 10. 12. 2024 | 186 |
| Phishing and Benign Domain Dataset | 20. 9. 2023 | 123 |
| Spotting the Hook dataset | 24. 6. 2024 | 11 |
| Total | 2,165 |